It starts innocently. One report needs order data from SAP next to a customer list that lives in an external database. Someone downloads two files, writes a lookup formula and shares the result. Fifteen minutes of work.
Then the report becomes monthly. Then a second merge is added. A year later there is a file called final_v7, one person who prepares it, and a week during their holiday when the report does not appear. The merge rule is written down nowhere. It lives inside a formula.
Where the join rule actually lives today
This is the part that is hard to put a number on: a business rule has moved out of the organisation and onto a laptop. Who announces a change to it, what makes the result correct, and why last month’s figure was different are now questions without answers.
The first idea at this point is usually to set up an ETL tool. For some requirements that is the right call. But when a single report needs two sources side by side, BI Portal handles it in place as a defined flow.
A join node and a union node fail differently
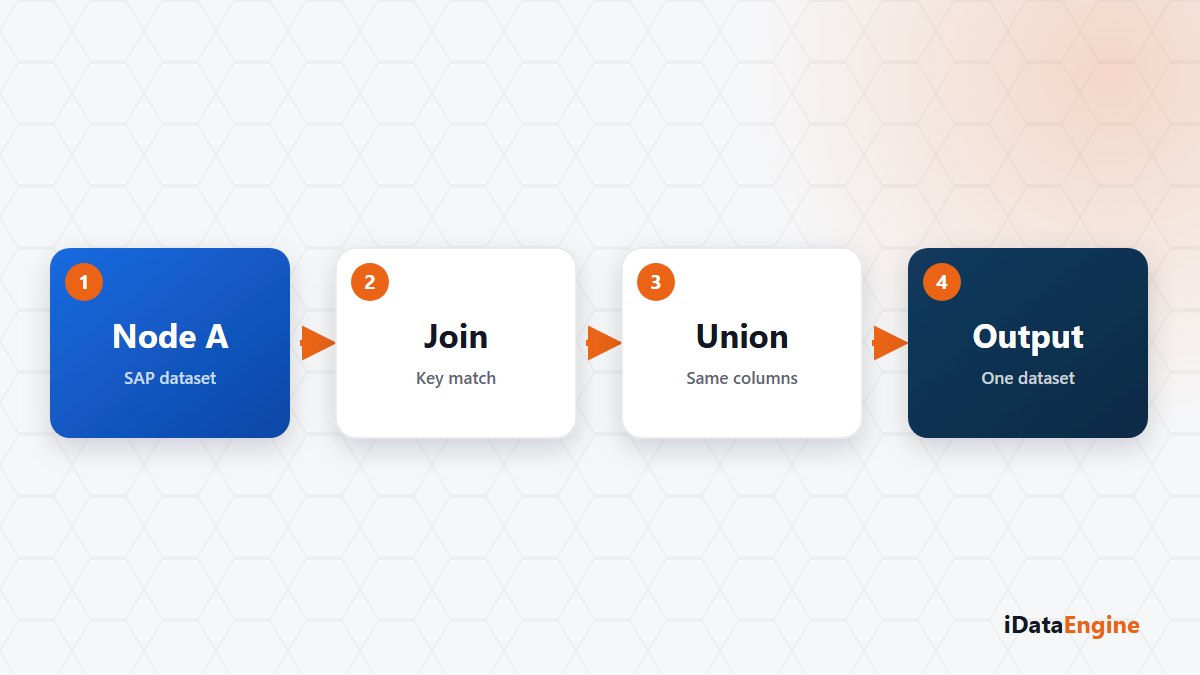
A flow is built from nodes in a drag-and-drop designer: source, transformation, filter, aggregation, join, union, write to a data source and email target.
The two combination nodes solve different problems and break in different ways. A join places two data sets side by side on a shared key, and the risk is row multiplication, so do not move on until you are sure the key is unique on both sides. A union stacks rows, and the risk is column mismatch: if names and types do not line up, the result is quietly wrong.
Every node can be previewed on its own, so both risks are visible at design time. Skipping previews and running the whole flow means looking for the error at the last step.
Why node order shapes the design
Nodes form a directed graph and execute in topological order. The current executor processes them sequentially on a single thread, so nodes do not run in parallel. Knowing that changes the design: filter a heavy source at the start, drop unnecessary columns early, keep intermediate results small.
Row-count and runtime guardrails can be set for a flow, and run records are kept for the flow and for its nodes. When a regularly scheduled flow starts behaving differently, you can see which run changed, which is faster than re-litigating the join logic every time.
What to do with the flow output
The result can go to two places. It can be written into the cache of a new BI data source: the flow runs once, the combined result becomes a source, and dashboards read from it. The same join no longer has to be rebuilt inside every widget.
The second route is an email target. The verified attachment format there is CSV with a UTF-8 BOM, so do not expect an Excel file on that path. Flow runs and cache refreshes can be scheduled through the shared job framework, which also takes the monthly report off one person’s calendar.
Two checks before any run are worth the habit: write down the row count you expect after the combination and compare it against the result, and verify a handful of records by hand. A total can look right while a breakdown is wrong. If you have two sources being merged in Excel every month, that merge can be expressed as a single flow definition. Tell us which two sources they are and we will design the first one with you.