“The dashboard is empty.” That one sentence is how most problems reach an analytics team. Behind it sit six different possibilities, and each one is fixed somewhere else.
Most teams start with the widget settings. That is usually the long way around, because the place where the problem was born sits well before the settings screen.
The cost here is not technical. The same question lands on the same person every week, and once trust in a management dashboard slips, people quietly go back to their own spreadsheet. Six months later nobody opens the page at all.
The six links behind one chart
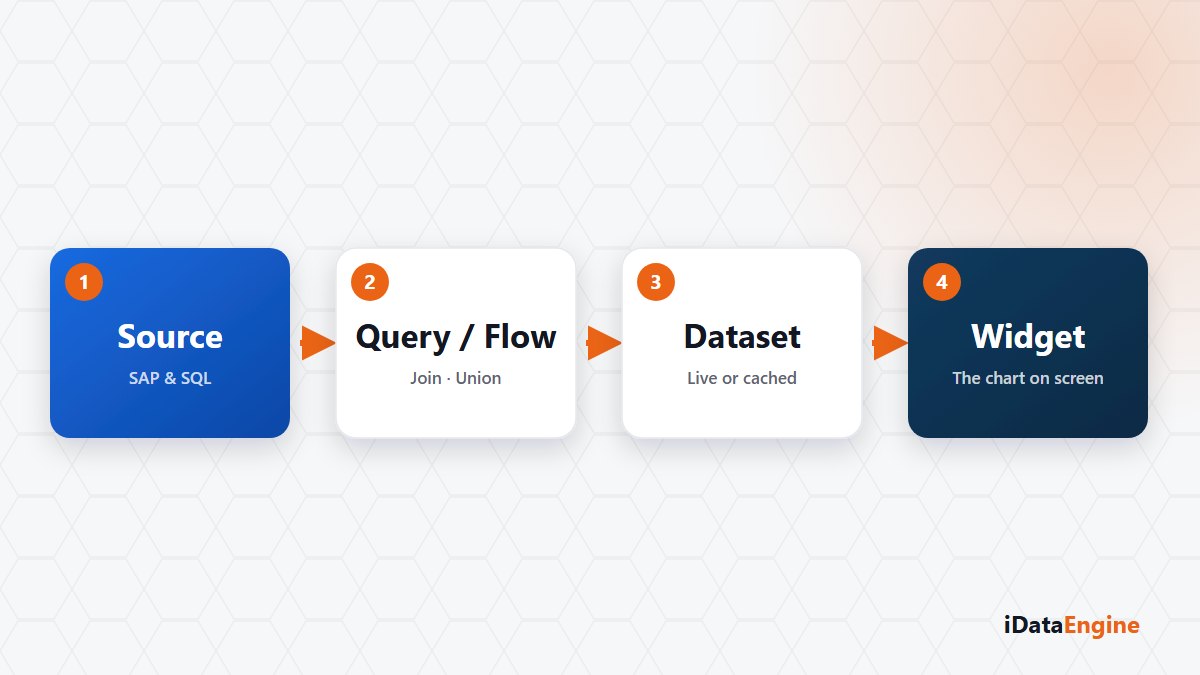
In BI Portal, data moves in this order: source, cache, model and transformation, view, widget, authorization. On the source side you can define PostgreSQL, Microsoft SQL Server, Fabric Lakehouse, Fabric Warehouse, SAP objects, Web API, JSON, Excel and CSV.
For offline use, data is loaded into PostgreSQL cache tables. The model layer combines several sources using relationship, key and cardinality definitions, while transformations handle filtering, grouping and calculated columns. Widget data endpoints then apply the measure, dimension, filter, sort order and the user’s data authorization together.
What reading the chain from the top buys you
- Source. Does the connection test pass, do sample rows come back? What state are the column definitions and types in?
- Cache. If the view runs offline, has the cache been built? When did the refresh job last finish successfully?
- Model. Are the relationship and cardinality right? A wrong relationship does more than duplicate data; with a filter applied it produces an empty result.
- Widget. Are the measure, dimension and aggregation method compatible with the field types?
- Authorization. Open the same view with the role of the user who reported the problem, not with your own.
The order looks tedious and it pays for itself: a large share of these tickets close before step four. Skip it and something worse happens. Someone changes the widget settings, the problem disappears by accident, and nobody knows what fixed it.
Why an authorization gap stays silent
Authorization is the link that costs the most time, because it raises no error. If a source has an authorization field defined and the user lacks the matching role, the query returns nothing; the system is not obliged to announce that access was denied. So the first place to look is the folder, view and role assignments in the diagnostics screen.
The second silent cause is the source mode. A widget running offline does not fall back to a live query when the cache is missing; it raises an error instead. That is deliberate, because a silent fallback would push unannounced load onto the source system.
The third is a naming collision. BI Portal and REP iDataView report design are not the same area. Clarifying which one a user means by “the report is empty” cuts the search in half.
Writing this chain down once, in your own organisation’s language, turns every empty-screen ticket into a short checklist. Pick the dashboard that generates the most complaints on your side, and we will walk the six links with your own sources and roles to pin down where the gap begins.